This page was generated from examples/models/statsmodels/statsmodels.ipynb.
Deploying Time-Series Models on Seldon
The following notebook are steps to deploy your first time-series model on Seldon. The first step is to install statsmodels on our local system, along with s2i. s2i will be used to convert the source code to a docker image and stasmodels is a python library to build statistical models.
Dependencies:
Seldon-core (https://docs.seldon.io/projects/seldon-core/en/v1.1.0/workflow/install.html)
s2i - Source to Image
statsmodels (https://www.statsmodels.org/stable/index.html)
Assuming you have installed statsmodels and s2i, the next step is to create a joblib file of your time-series model. The sample code is given below . Here we have considered a Holt- Winter’s seasonal model and the shampoo sales dataset as a basic example.
The univariate dataset : https://raw.githubusercontent.com/jbrownlee/Datasets/master/shampoo.csv
[ ]:
!pip install statsmodels
Code snippet to create a joblib file :
[ ]:
import joblib
import numpy as np
import pandas as pd
from statsmodels.tsa.holtwinters import ExponentialSmoothing

df = pd.read_csv(
    "https://raw.githubusercontent.com/jbrownlee/Datasets/master/shampoo.csv"
)

# Taking a test-train split of 80 %
train = df[0 : int(len(df) * 0.8)]
test = df[int(len(df) * 0.8) :]

# Pre-processing the  Month  field
train.Timestamp = pd.to_datetime(train.Month, format="%m-%d")
train.index = train.Timestamp
test.Timestamp = pd.to_datetime(test.Month, format="%m-%d")
test.index = test.Timestamp

# fitting the model based on  optimal parameters
model = ExponentialSmoothing(
    np.asarray(train["Sales"]),
    seasonal_periods=7,
    trend="add",
    seasonal="add",
).fit()
joblib.dump(model, "model.sav")
The Next step is to write the code in a format defined by s2i as given below :
[ ]:
%%writefile holt_winter.py

import joblib
class holt_winter(object):
    """
    Model template. You can load your model parameters in __init__ from a location accessible at runtime
    """

    def __init__(self):

        """
        Add any initialization parameters. These will be passed at runtime from the graph definition parameters defined in your seldondeployment kubernetes resource manifest.

        loading the joblib file
        """
        self.model = joblib.load('model.sav')
        print("Initializing ,inside constructor")


    def predict(self,X,feature_names):
        """
        Return a prediction.
        Parameters
        ----------
        X : array-like
        feature_names : array of feature names (optional)

        This space can be used for data pre-processing as well
        """
        print(X)
        print("Predict called - will run idenity function")
        return self.model.forecast(X)
After saving the code, we now create an environment_rest file and add the following lines:
MODEL_NAME=holt_winter API_TYPE=REST SERVICE_TYPE=MODEL PERSISTENCE =0
MODEL_NAME: The name of the class containing the model. Also the name of the python file which will be imported.
API_TYPE: API type to create. Can be REST or GRPC
SERVICE_TYPE: The service type being created. Available options are: 1. MODEL 2. ROUTER 3. TRANSFORMER 4. COMBINER 5. OUTLIER_DETECTOR
PERSISTENCE: Set either to 0 or 1. Default is 0. If set to 1 then your model will be saved periodically to redis and loaded from redis (if exists) or created fresh if not.
[ ]:
%%writefile requirements.txt
joblib
statsmodels
pandas
numpy
[ ]:
%%writefile environment_rest

MODEL_NAME=holt_winter
API_TYPE=REST
SERVICE_TYPE=MODEL
PERSISTENCE =0
Now we build the image using the s2i command, replace “seldonio/statsmodel-holts:0.1” with the image name of your choice :
[ ]:
!s2i build -E environment_rest . seldonio/seldon-core-s2i-python37-ubi8:1.7.0-dev seldonio/statsmodel-holts:0.1
Running the docker image created:
[ ]:
!docker run --name "holt_predictor" -d --rm -p 5000:5000 seldonio/statsmodel-holts:0.1
The code is now running at the local host at port 5000. It can be tested by sending a curl command, here we are sending a request to the model to predict the sales for the next 3 weeks.
[ ]:
!curl -s http://localhost:5000/predict -H "Content-Type: application/json" -d '{"data":{"ndarray":3}}'
The next step is to push the code into the docker registry, you are free to use the docker hub or the private registry in your cluster.
[ ]:
!docker push seldonio/statsmodel-holts:0.1
The final step is to deploy the configuration file on your cluster as shown below.
[ ]:
%%writefile model.yaml

apiVersion: machinelearning.seldon.io/v1alpha2
kind: SeldonDeployment
metadata:
  name: holt-predictor
spec:
  name: holt-predictor
  predictors:
  - componentSpecs:
    - spec:
        containers:
        - image: seldonio/statsmodel-holts:0.1
          imagePullPolicy: IfNotPresent
          name: holt-predictor
    graph:
      children: []
      endpoint:
        type: REST
      name: holt-predictor
      type: MODEL
    name: holt-predictor
    replicas: 1
[ ]:
!kubectl apply -f model.yaml
Your model will now be deployed as a service, create a route in order for external traffic to access it . A sample curl request (with a dummy I.P, replace it with the route created by you) for the model is :
[ ]:
!curl -s -d '{"data": {"ndarray":2}}' -X POST http://160.11.22.334:4556/seldon/testseldon/holt-predictor/api/v1.0/predictions -H "Content-Type: application/json"
In the above command, we send a request to get a prediction of the sales of the shampoo for the next 2 days. testseldon is the namespace, you can replace it with the namespace created by you where the model is deployed .
The response we get is :
{“data”:{“names”:[],”ndarray”:[487.86681173,415.82743026 ]},”meta”:{}}
The data returned is an n-dimensional array with 2 values which is the predicted values by the model, in this case the sales of the shampoo.
Note: it is suggested that you try the model on your local system before deploying it on the cluster.
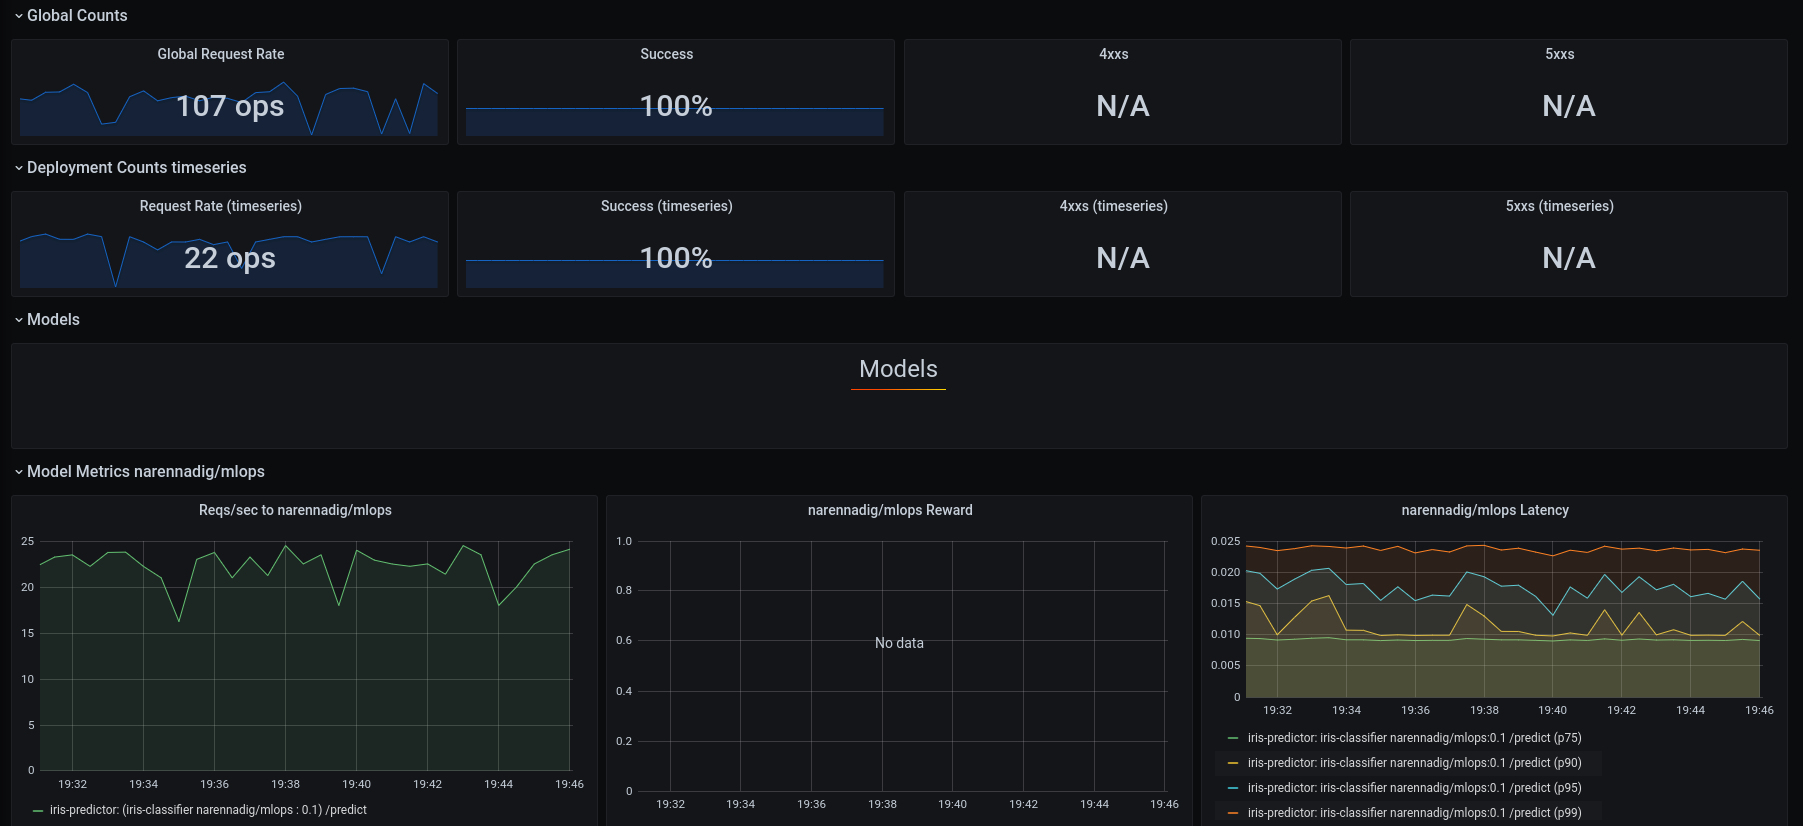
Model Monitoring
Once the model is deployed, you can now monitor various metrics, the 2 main ones being:
Requests per second
Latency in serving the request
Summary
This documentation covers deploying time series model on Seldon, this model could be inferenced for forecasting values from a given data set. This is very useful for customers who want to deploy time series alogithm for forecasting models.