Metrics
Seldon Core exposes metrics that can be scraped by Prometheus. The core metrics are exposed by the service orchestrator (executor).
The metrics are:
Prediction Requests
Requests to the service orchestrator from an ingress, e.g. API gateway or Ambassador
seldon_api_executor_server_requests_seconds_(bucket,count,sum)-histogramtype metricseldon_api_executor_server_requests_seconds_summary_(count,sum)-summarytype metric
Requests from the service orchestrator to a component, e.g., a model
seldon_api_executor_client_requests_seconds_(bucket,count,sum)-histogramtype metricseldon_api_executor_client_requests_seconds_summary_(count,sum)-summarytype metric
Each metric has the following key value pairs for further filtering which will be taken from the SeldonDeployment custom resource that is running:
service
deployment_name
predictor_name
predictor_version (This will be derived from the predictor metadata labels)
model_name
model_image
model_version
Metrics with Prometheus Operator
Installation
We recommend to configure Prometheus using Prometheus Operator. The kube-prometheus stack configuration can be easily installed using the Bitnami Helm Charts
kubectl create namespace seldon-monitoring

helm upgrade --install seldon-monitoring kube-prometheus \
    --version 8.3.2 \
    --set fullnameOverride=seldon-monitoring \
    --namespace seldon-monitoring \
    --repo https://charts.bitnami.com/bitnami

kubectl rollout status -n seldon-monitoring statefulsets/prometheus-seldon-monitoring-prometheus
The following pods should now be present in the seldon-monitoring namespace:
$ kubectl get pods -n seldon-monitoring
NAME                                            READY   STATUS    RESTARTS   AGE
alertmanager-seldon-monitoring-alertmanager-0   2/2     Running   0          51s
prometheus-kube-state-metrics-d97b6b5ff-n5z7w   1/1     Running   0          52s
prometheus-node-exporter-jmffw                  1/1     Running   0          52s
prometheus-seldon-monitoring-prometheus-0       2/2     Running   0          51s
seldon-monitoring-operator-6d558f5696-xhq66     1/1     Running   0          52s
Configuration
Following PodMonitor resource will instruct Prometheus to scrape ports named metrics from pods managed by Seldon Core.
Create seldon-podmonitor.yaml file
apiVersion: monitoring.coreos.com/v1
kind: PodMonitor
metadata:
  name: seldon-podmonitor
  namespace: seldon-monitoring
spec:
  selector:
    matchLabels:
      app.kubernetes.io/managed-by: seldon-core
  podMetricsEndpoints:
    - port: metrics
      path: /prometheus
  namespaceSelector:
    any: true
and apply it with
kubectl apply -f seldon-podmonitor.yaml
Verification
Assuming that there exist SeldonDeployment models running in the cluster one can verify Prometheus metrics by accessing the Prometheus UI.
Expose Prometheus to your localhost with
$ kubectl port-forward -n seldon-monitoring svc/seldon-monitoring-prometheus 9090:9090
You can now head to your browser http://localhost:9090 to access the Prometheus UI.
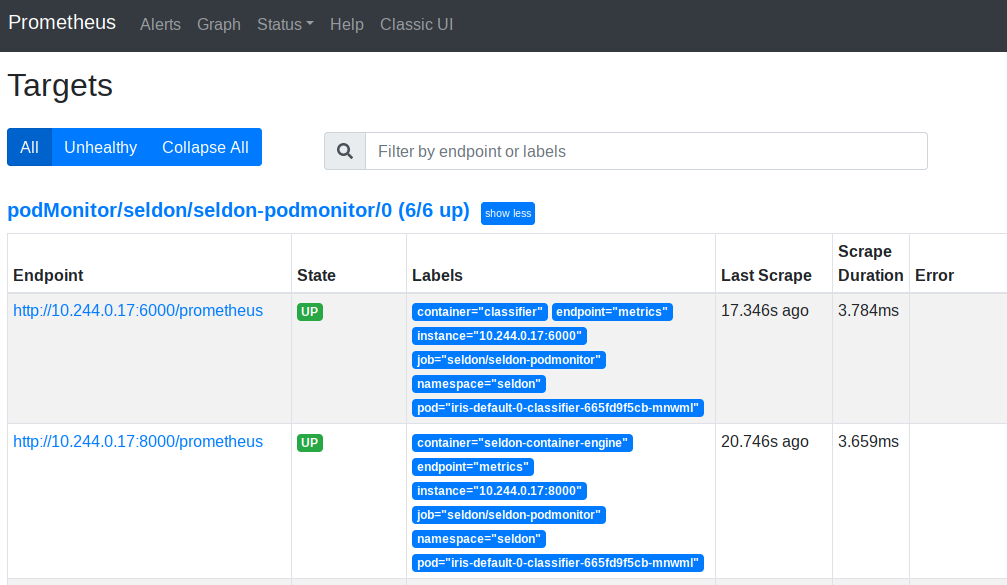
Start by verifying at Status -> Targets information.

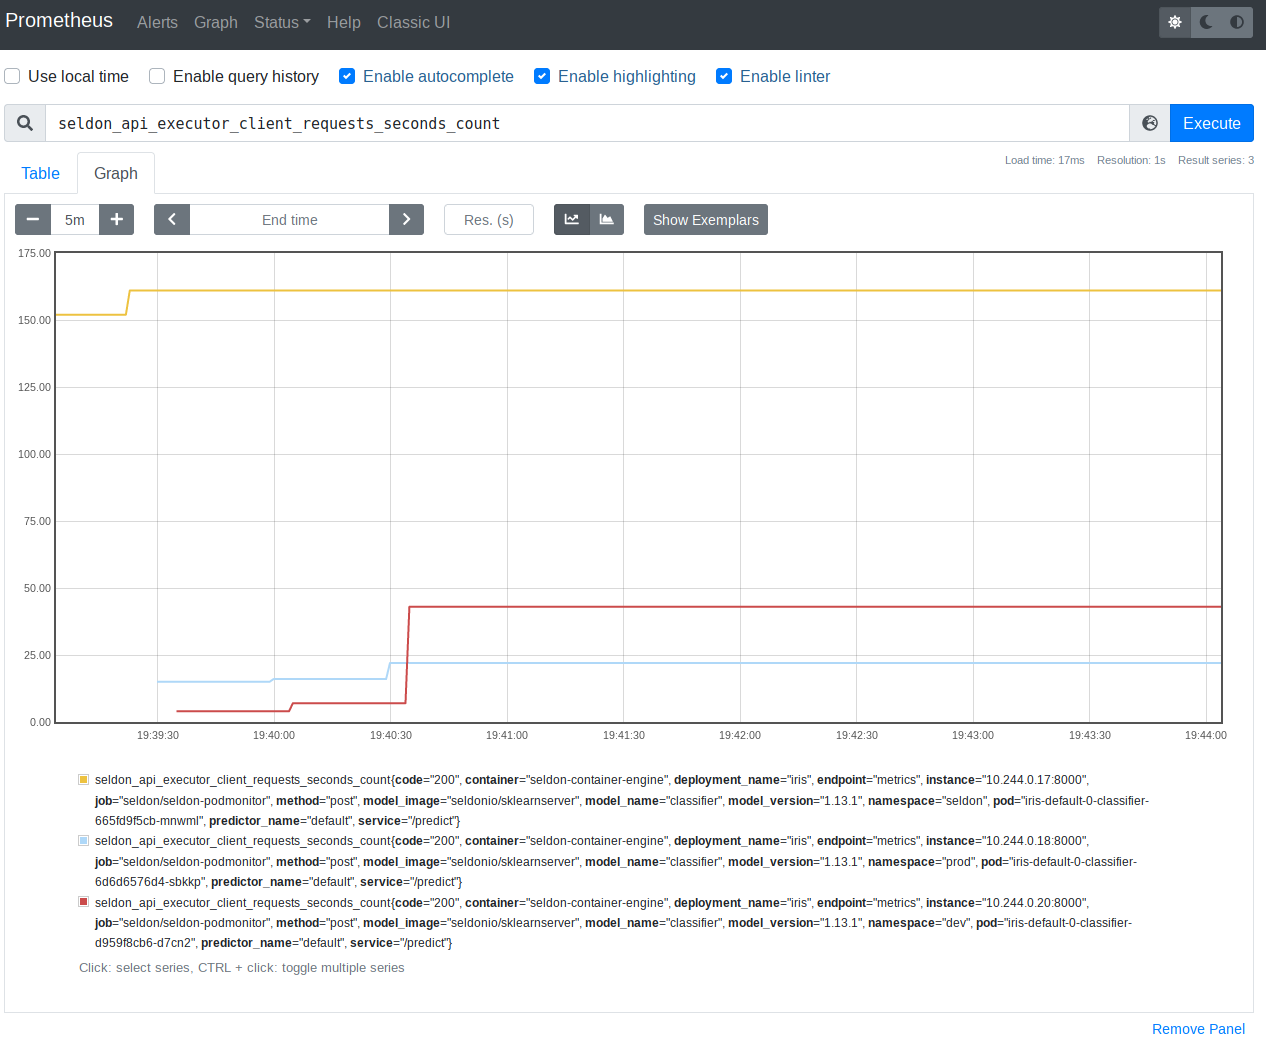
Then, head to Graph section and query for seldon_api_executor_client_requests_seconds_count.
You should see output similar to following (assuming that your SeldonDeployments are receiving some inference requests)

Custom Metrics
Seldon Core exposes basic metrics via Prometheus endpoints on its service orchestrator that include request count, request time percentiles and rolling accuracy for each running model as described in metrics documentation. However, you may wish to expose custom metrics from your components which are automatically added to Prometheus. For this purpose you can supply extra fields in the returned meta data of the response object in the API calls to your components as illustrated below:
{
    "meta": {
        "metrics": [
            {
                "type": "COUNTER",
                "key": "mycounter",
                "value": 1.0,
                "tags": {"mytag": "mytagvalue"}
            },
            {
                "type": "GAUGE",
                "key": "mygauge",
                "value": 22.0
            },
            {
                "type": "TIMER",
                "key": "mytimer",
                "value": 1.0
            }
        ]
    },
    "data": {
        "ndarray": [
            [
                1,
                2
            ]
        ]
    }
}
We provide three types of metric that can be returned in the meta.metrics list:
COUNTER : a monotonically increasing value. It will be added to any existing value from the metric key.
GAUGE : an absolute value showing a level, it will overwrite any existing value.
TIMER : a time value (in msecs), it will be aggregated into Prometheus’ HISTOGRAM.
Each metric, apart from the type, takes a key and a value. The proto buffer definition is shown below:
message Metric {
 enum MetricType {
     COUNTER = 0;
     GAUGE = 1;
     TIMER = 2;
 }
 string key = 1;
 MetricType type = 2;
 float value = 3;
 map<string,string> tags = 4;
}
Metrics endpoints
Custom metrics are exposed directly by the Python wrapper.
In order for Prometheus to scrape multiple endpoints from a single Pod we use metrics name for ports that expose Prometheus metrics:
ports:
- containerPort: 6000
  name: metrics
  protocol: TCP
If you configured Prometheus using Prometheus Operator as discussed above you should be set to go. If, however, you are configuring Prometheus not using Prometheus Operator this require us to use a following entry
- source_labels: [__meta_kubernetes_pod_container_port_name]
  action: keep
  regex: metrics(-.*)?
in the Prometheus config together with following two annotations:
prometheus.io/scrape: "true"
prometheus.io/path: "/prometheus"
Note: we do not use prometheus.io/port annotation in this configuration.
Before Seldon Core 1.1 custom metrics have been returned to the orchestrator which exposed them all together to Prometheus via a single endpoint.
We used to have at this time all three following annotations:
prometheus.io/scrape: "true"
prometheus.io/path: "/prometheus"
prometheus.io/port: "8000"
Labels
As we expose the metrics via Prometheus, if tags are added they must appear in every metric response otherwise Prometheus will consider such metrics as a new time series, see official documentation.
Before Seldon Core 1.1 orchestrator enforced presence of same set of labels using the micrometer library to expose metrics. Exceptions would happen if this condition have been violated.
Supported wrappers
At present the following Seldon Core wrappers provide integrations with custom metrics:
Example
There is an example notebook you can use to test the metrics.